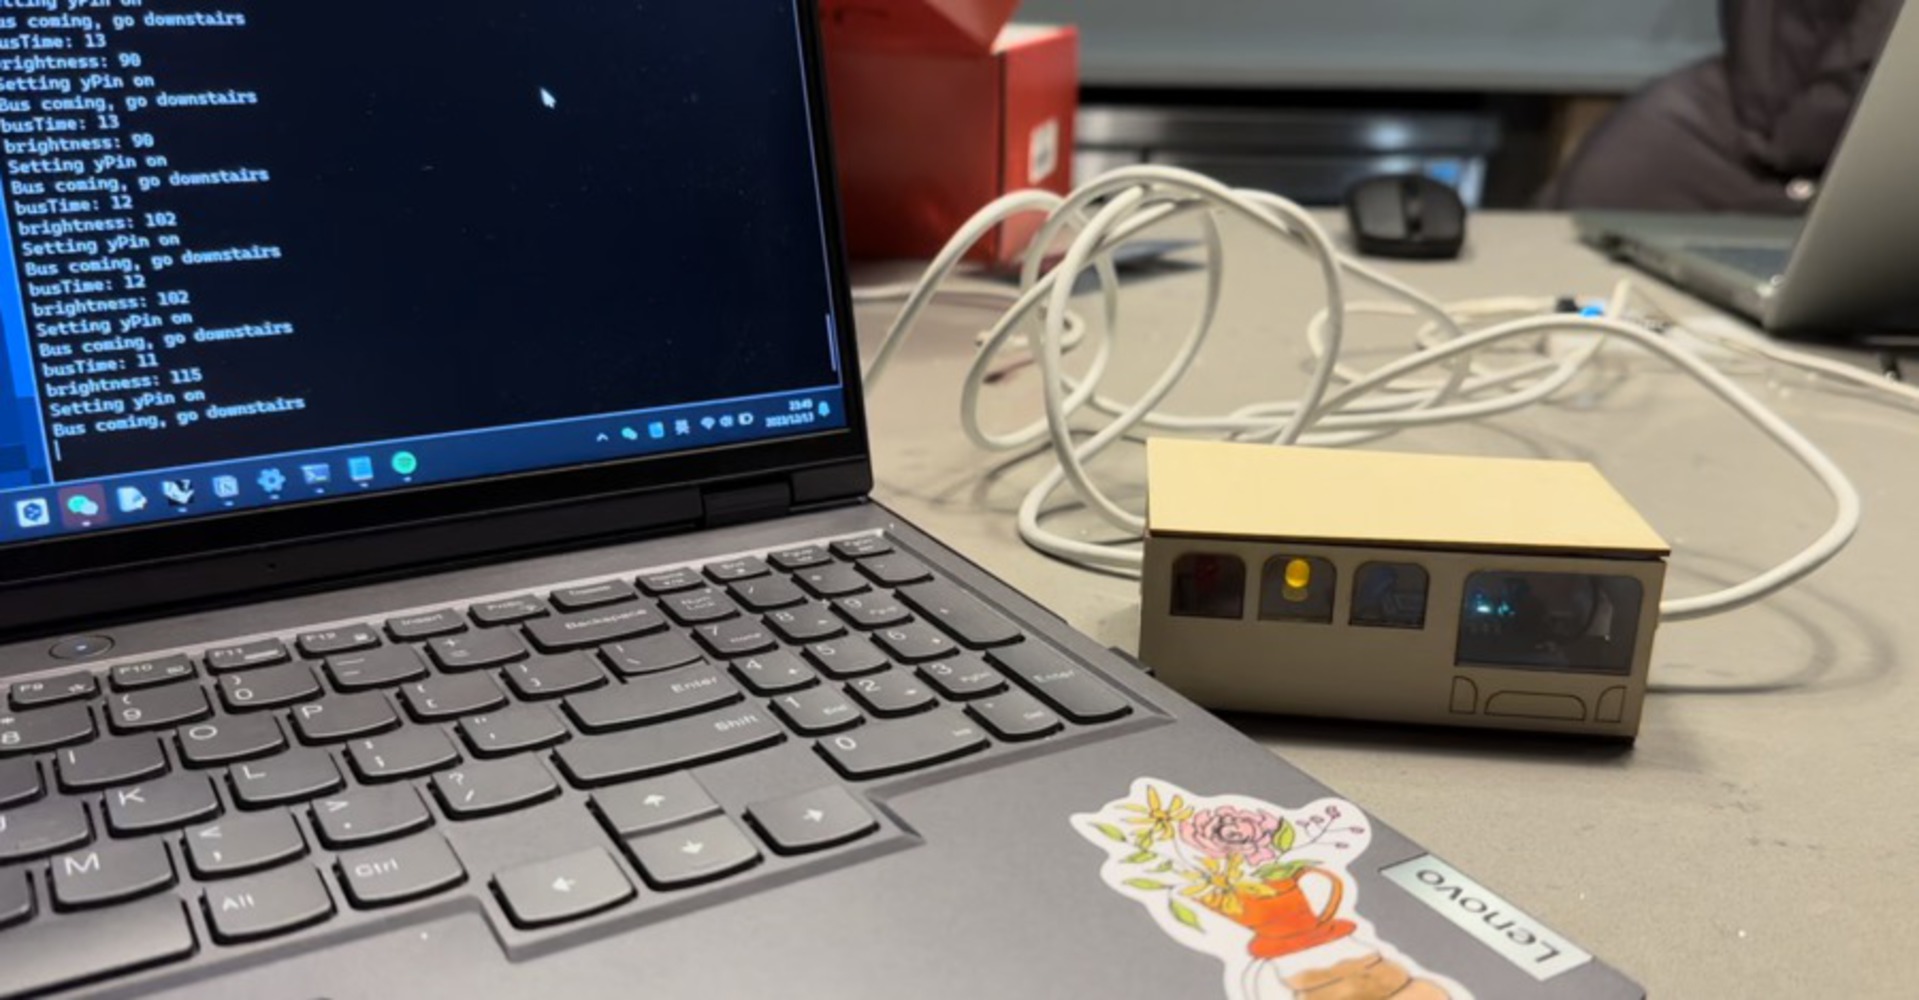
Junke Zhao

Track Your Route

A desktop interactive installation using IoT and API to help you track the weather and traffic on your way to school.

Team Member
Junke Zhao
Max Yuhan Wu
Xuan Peng
Duration
Nov 2023 - Dec 2023
Contribution
Concept Design, Modelling, Fabrication, Coding, Drawing

Background

Commuting to campus by bus this semester, which is mainly 61 A / B / C / D, it is really common to see them come and go all together. As can be seen from the photo, it looks almost like a train coming through when is 4 of them arriving at the same time. Visualization created by CMU alumni Mark Egge is an amazing illustration for how bunching 61 routes are appearing in areas around the campus.

Imagine when the weather gets worse and you miss a couple of buses that came together. This is really not a pleasant experience. And we would love to have a device that perhaps show us weather and bus status.

Bus Bunching Frequency Visualization
61D Bus Photo

Concepts

The project would consist of a bus info display kit and a weather display kit.

The bus tracker would be a box with an acrylic piece embedded in it that could display different colors with a Neo Pixel strip or a few LEDs inside of the box. Interactions are pictured to remind users to get prepared to go get a bus, go downstairs to the bus station, and lastly, inform that the user might need to take another bus. When the bus arrives, the light starts to subtly shift to a blue or green hue. When is about time to go to the station, the transition would be quicker. And fading to a yellow color would mean that the bus is now here or gone.

Concept Sketches

Precedent Study

Weather System by Studio PSK, Paper Signals by Isaac Blankensmith, Tempescope by Ken Kawamoto are fascinating cases that signals and subtly display the weather, by sounds, visualization and motions. The key takeaway for us is that the status and translation of signaling by different types of actuators creates various possibilities.

Case Studies
Case Studies

Design Process

Our project is divided into two main parts, one is real-time crawling of bus schedules as well as alerts and the other is a weather indicator. We split up and synchronized these two directions, the first step was to get the API for bus schedule and real time snowfall and send it to the Particle microcontroller. The other step is to design the visualization and interaction of the information, how to represent the crawled bus time and snowfall information in the IoT devices.

Process of Bus Tracker

In terms of API for bus information, we managed to receive an API key from the PRT and start with the information provided. Among these we found that route data or vehicle locations might be useful. Also we tested with the web hook from PRT to see how the API works.

When started to test with data from multiple routes and couldn't visualize the data in a legible way, as the indicators would get more complicated. So you went back to the one route solution. We chose to hook our argon with the data of prediction time for inbound bus route 61D at Forbes & Morewoods that takes all of the team members back to residence in Oakland from campus.

Below is the photo showing the process of testing the bus tracker on serial print monitor. We started with mapping the maximum brightness of the LEDs using the prediction time into the range of 255-100, meaning when the bus is almost there it would be fully on in red, when it is far away it would be a dim blue light. But it appears that the dim part of yellow and blue is not really seen. So we chose to map the brightness of each LED using its time within its range of loop. In that case the brightness is more obvious in every time range.

Bus Tracker Testing Process

Process of Snow Ball

Using the Open Meteo weather API, we tested data requests for temperature, rainfall, snowfall, and weather codes. Rain and snow data were provided as depth measurements, but we weren't entirely clear on the exact values, so we used approximate ranges for our conditional statements. API link

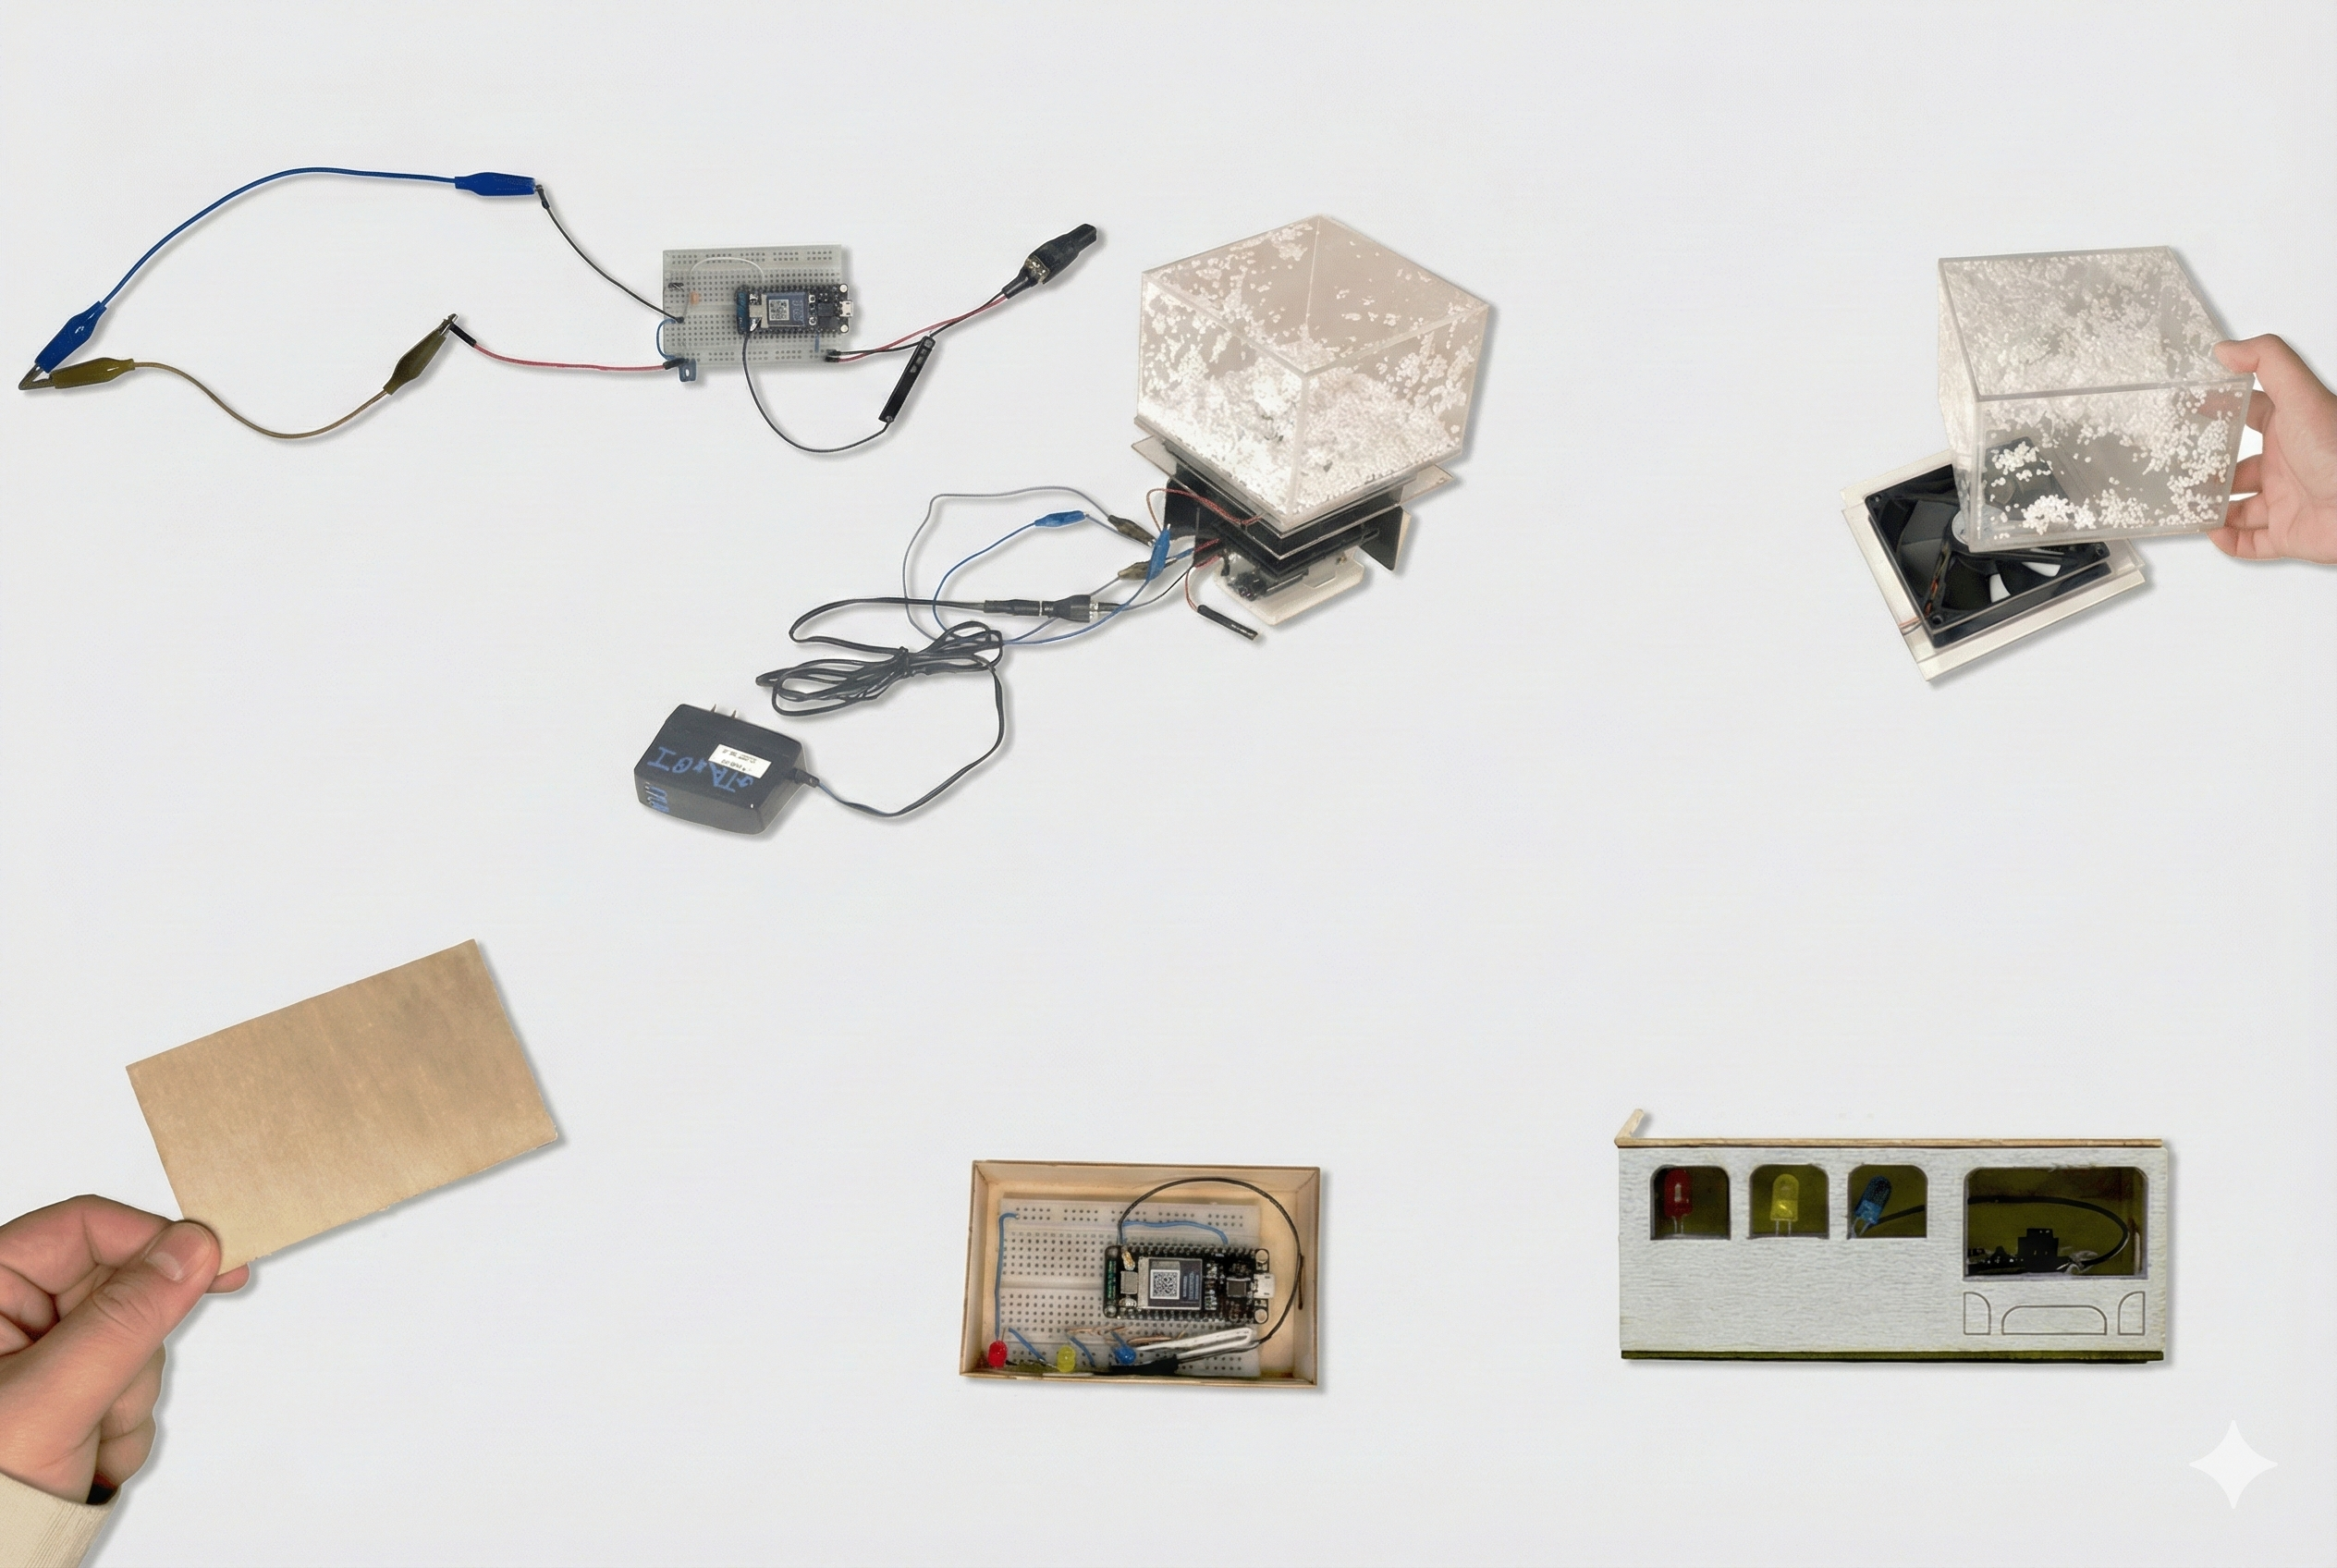
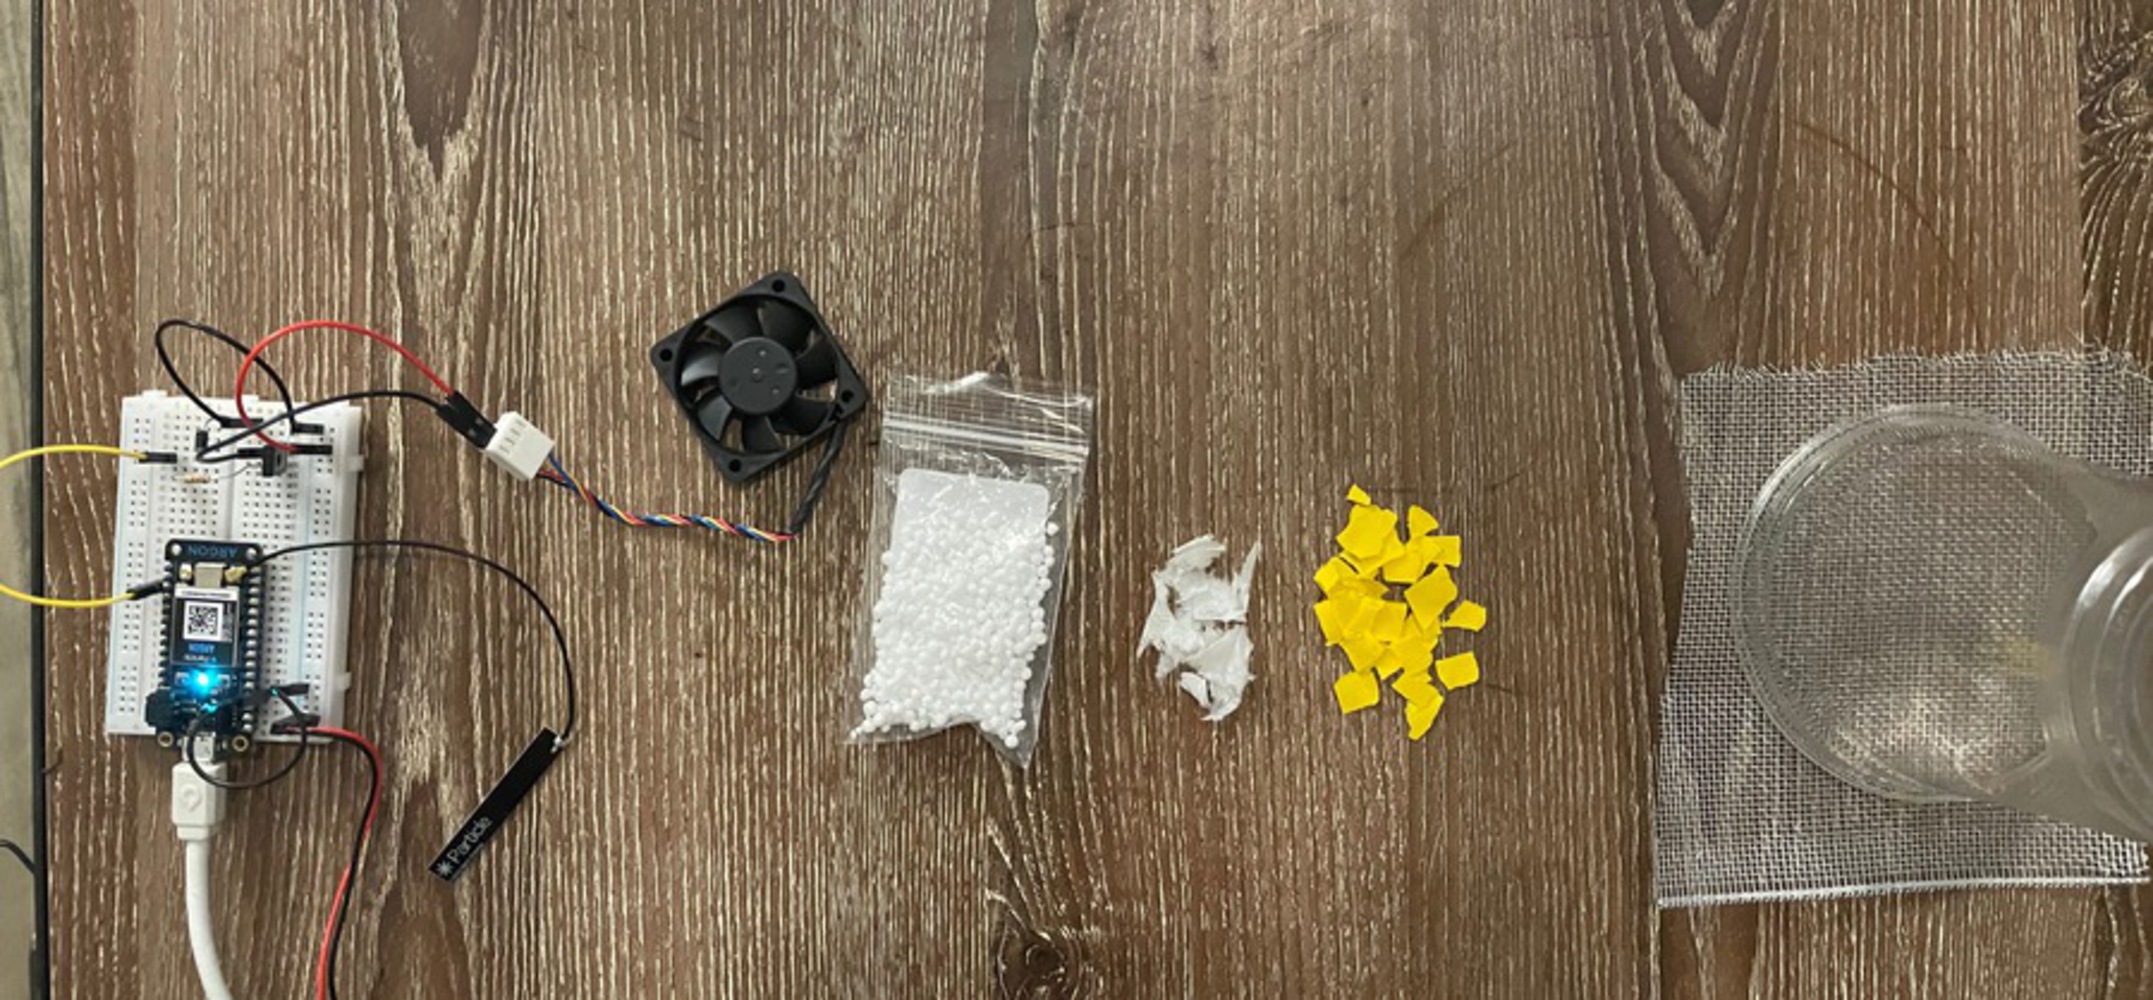
We quickly realized that the solenoids couldn't produce enough force to move the beads through the air as intended.

Moving forward, we tested a 5-volt mini DC fan (photo below) and achieved initial results. Prof. Daragh suggested using a more powerful 12-volt DC fan, which finally felt adequate for the project. To test the effect, we built a basic model using a plastic cup and aluminum mesh screen. To keep the beads contained, Prof. Daragh recommended adding a rubber band, which proved very helpful. Of all materials tested, we found the foam beads particularly interesting visually, so we decided to focus on those.

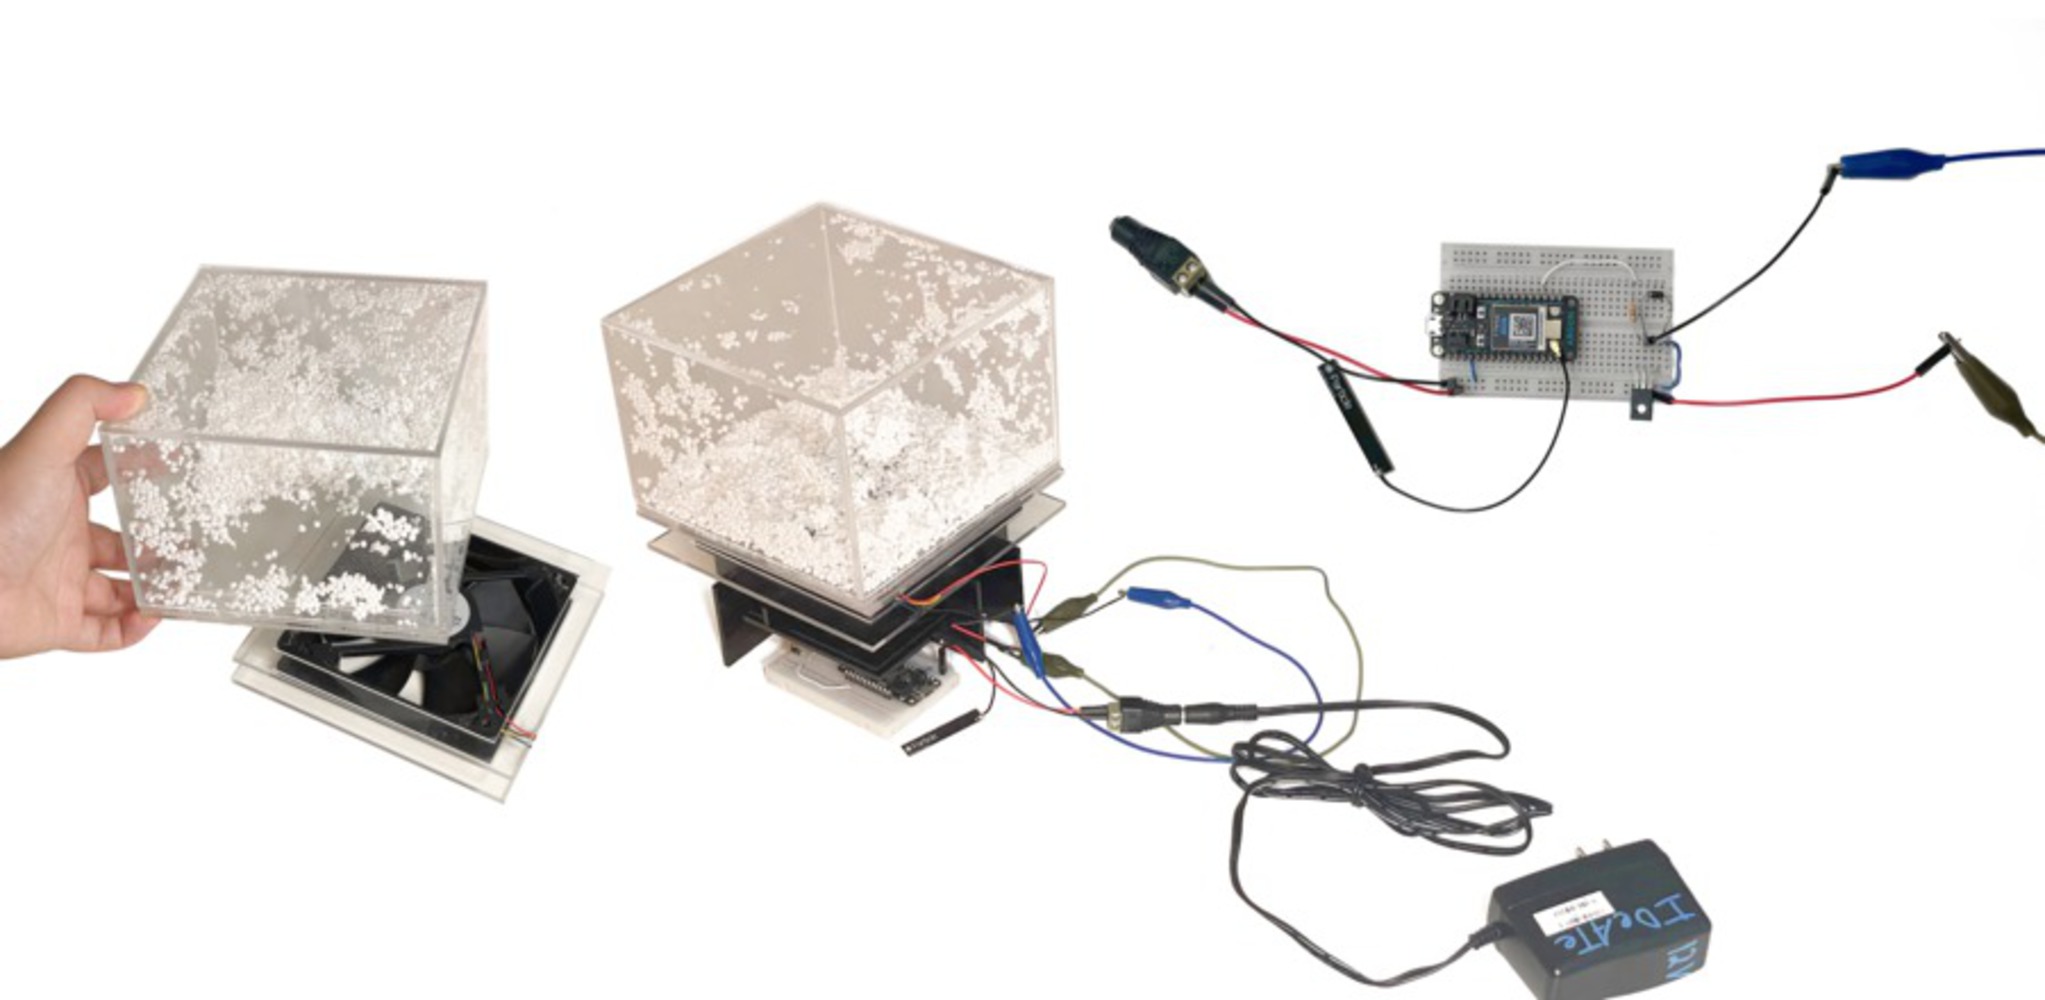
The DC motor's back-and-forth motion during testing added a nice effect, smoothly oscillating on the granite countertop (see the YouTube video below). Additionally, we noticed that pointing the fan upward allowed the fan structure to block airflow to the center of the container. By reversing the fan direction, we created an airflow that effectively moved the beads across the container.

Snow Ball Testing Components
DC Fan Test

Final Outcomes

Bus Time Tracker
Bus Time Tracker
Snowball Indicator
Snowball Indicator
Prototype Video